Class 8 Maths Data Handling Worksheet — Free Printable PDF
Download a free Class 8 Maths worksheet on Data Handling with MCQs, fill in the blanks and short answer questions. Complete answer key included. Personalized to your class, subject and chapter.
⭐ MeritMate — Class 8 Maths: Data Handling
Curriculum-Aware · meritmate.inSection A: Multiple Choice Questions
Q1. A pie chart is used to show data as parts of a:
a) Line
b) Whole
c) Bar
d) Table
Q2. In a bar graph, the height of each bar represents the:
a) Width of data
b) Frequency or value of data
c) Number of categories
d) Title of the graph
Q3. Which of the following is NOT a way of representing data?
a) Bar graph
b) Pie chart
c) Histogram
d) Dictionary
Q4. The probability of an impossible event is:
a) 1
b) 0.5
c) 0
d) Greater than 1
Q5. A die is thrown once. The probability of getting an even number is:
a) 1/3
b) 2/3
c) 1/2
d) 1/6
Section B: Fill in the Blanks
Q6. A pie chart is also known as a ________.
Q7. The sum of all probabilities of all possible outcomes of an experiment is always ________.
Q8. In a histogram, the bars are drawn ________ to each other with no gaps.
Q9. The probability of getting a head when a coin is tossed once is ________.
Q10. Data that has been collected but not organised in any form is called ________.
Section C: Short Answer Questions
Q11. A bag contains 3 red balls, 4 blue balls and 3 green balls. If one ball is drawn at random, find the probability that the ball drawn is blue.
Q12. The following data shows marks scored by 5 students: 45, 60, 55, 70, 45. Find the range of the data.
Q13. A card is drawn from a well shuffled deck of 52 cards. What is the probability that the card drawn is a king?
Q14. Explain the difference between a bar graph and a histogram with one example each.
Q15. In a class of 40 students, 10 like cricket, 15 like football and 15 like basketball. Draw a pie chart showing this data by finding the central angles for each activity.
⭐ Answer Key
Class 8 · Maths · Data HandlingAnswer Key
Q1. b) Whole
Q2. b) Frequency or value of data
Q3. d) Dictionary
Q4. c) 0
Q5. c) 1/2
Q6. A pie chart is also known as a circle graph.
Q7. The sum of all probabilities of all possible outcomes of an experiment is always 1.
Q8. In a histogram, the bars are drawn adjacent to each other with no gaps.
Q9. The probability of getting a head when a coin is tossed once is 1/2.
Q10. Data that has been collected but not organised in any form is called raw data.
Q11. Total number of balls = 3 + 4 + 3 = 10
Number of blue balls = 4
Probability of drawing a blue ball = 4/10 = 2/5
Q12. Range = Highest value minus Lowest value
Range = 70 minus 45 = 25
Q13. Total number of cards = 52
Number of kings in a deck = 4
Probability of drawing a king = 4/52 = 1/13
Q14. A bar graph is used to represent data with gaps between the bars, and the data can be of any category such as favourite fruits of students. A histogram is used to represent continuous data in the form of class intervals, and the bars have no gaps between them, such as the height of students grouped in intervals of 140 to 150 cm, 150 to 160 cm and so on.
Q15. Total students = 40
Cricket: (10/40) x 360 = 90 degrees
Football: (15/40) x 360 = 135 degrees
Basketball: (15/40) x 360 = 135 degrees
The central angles for cricket, football and basketball are 90 degrees, 135 degrees and 135 degrees respectively. These three angles add up to 360 degrees, which completes the pie chart.
More Class 8 Maths Worksheets
Want a different worksheet on Data Handling?
Generate a fresh set of unique questions instantly. ✨ Generate My Free Worksheet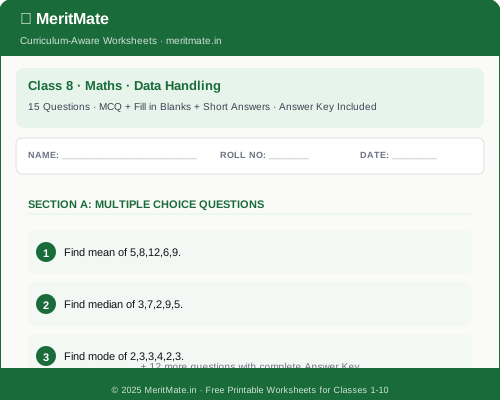
Sample preview — Download full worksheet with complete answer key